Statistics overview
Introduction
If you have a Team or Enterprise plan, you can use the Statistics module in your organisation. Unfortunately, users with the Pro plan do not have access to it.
Default Statistics Board
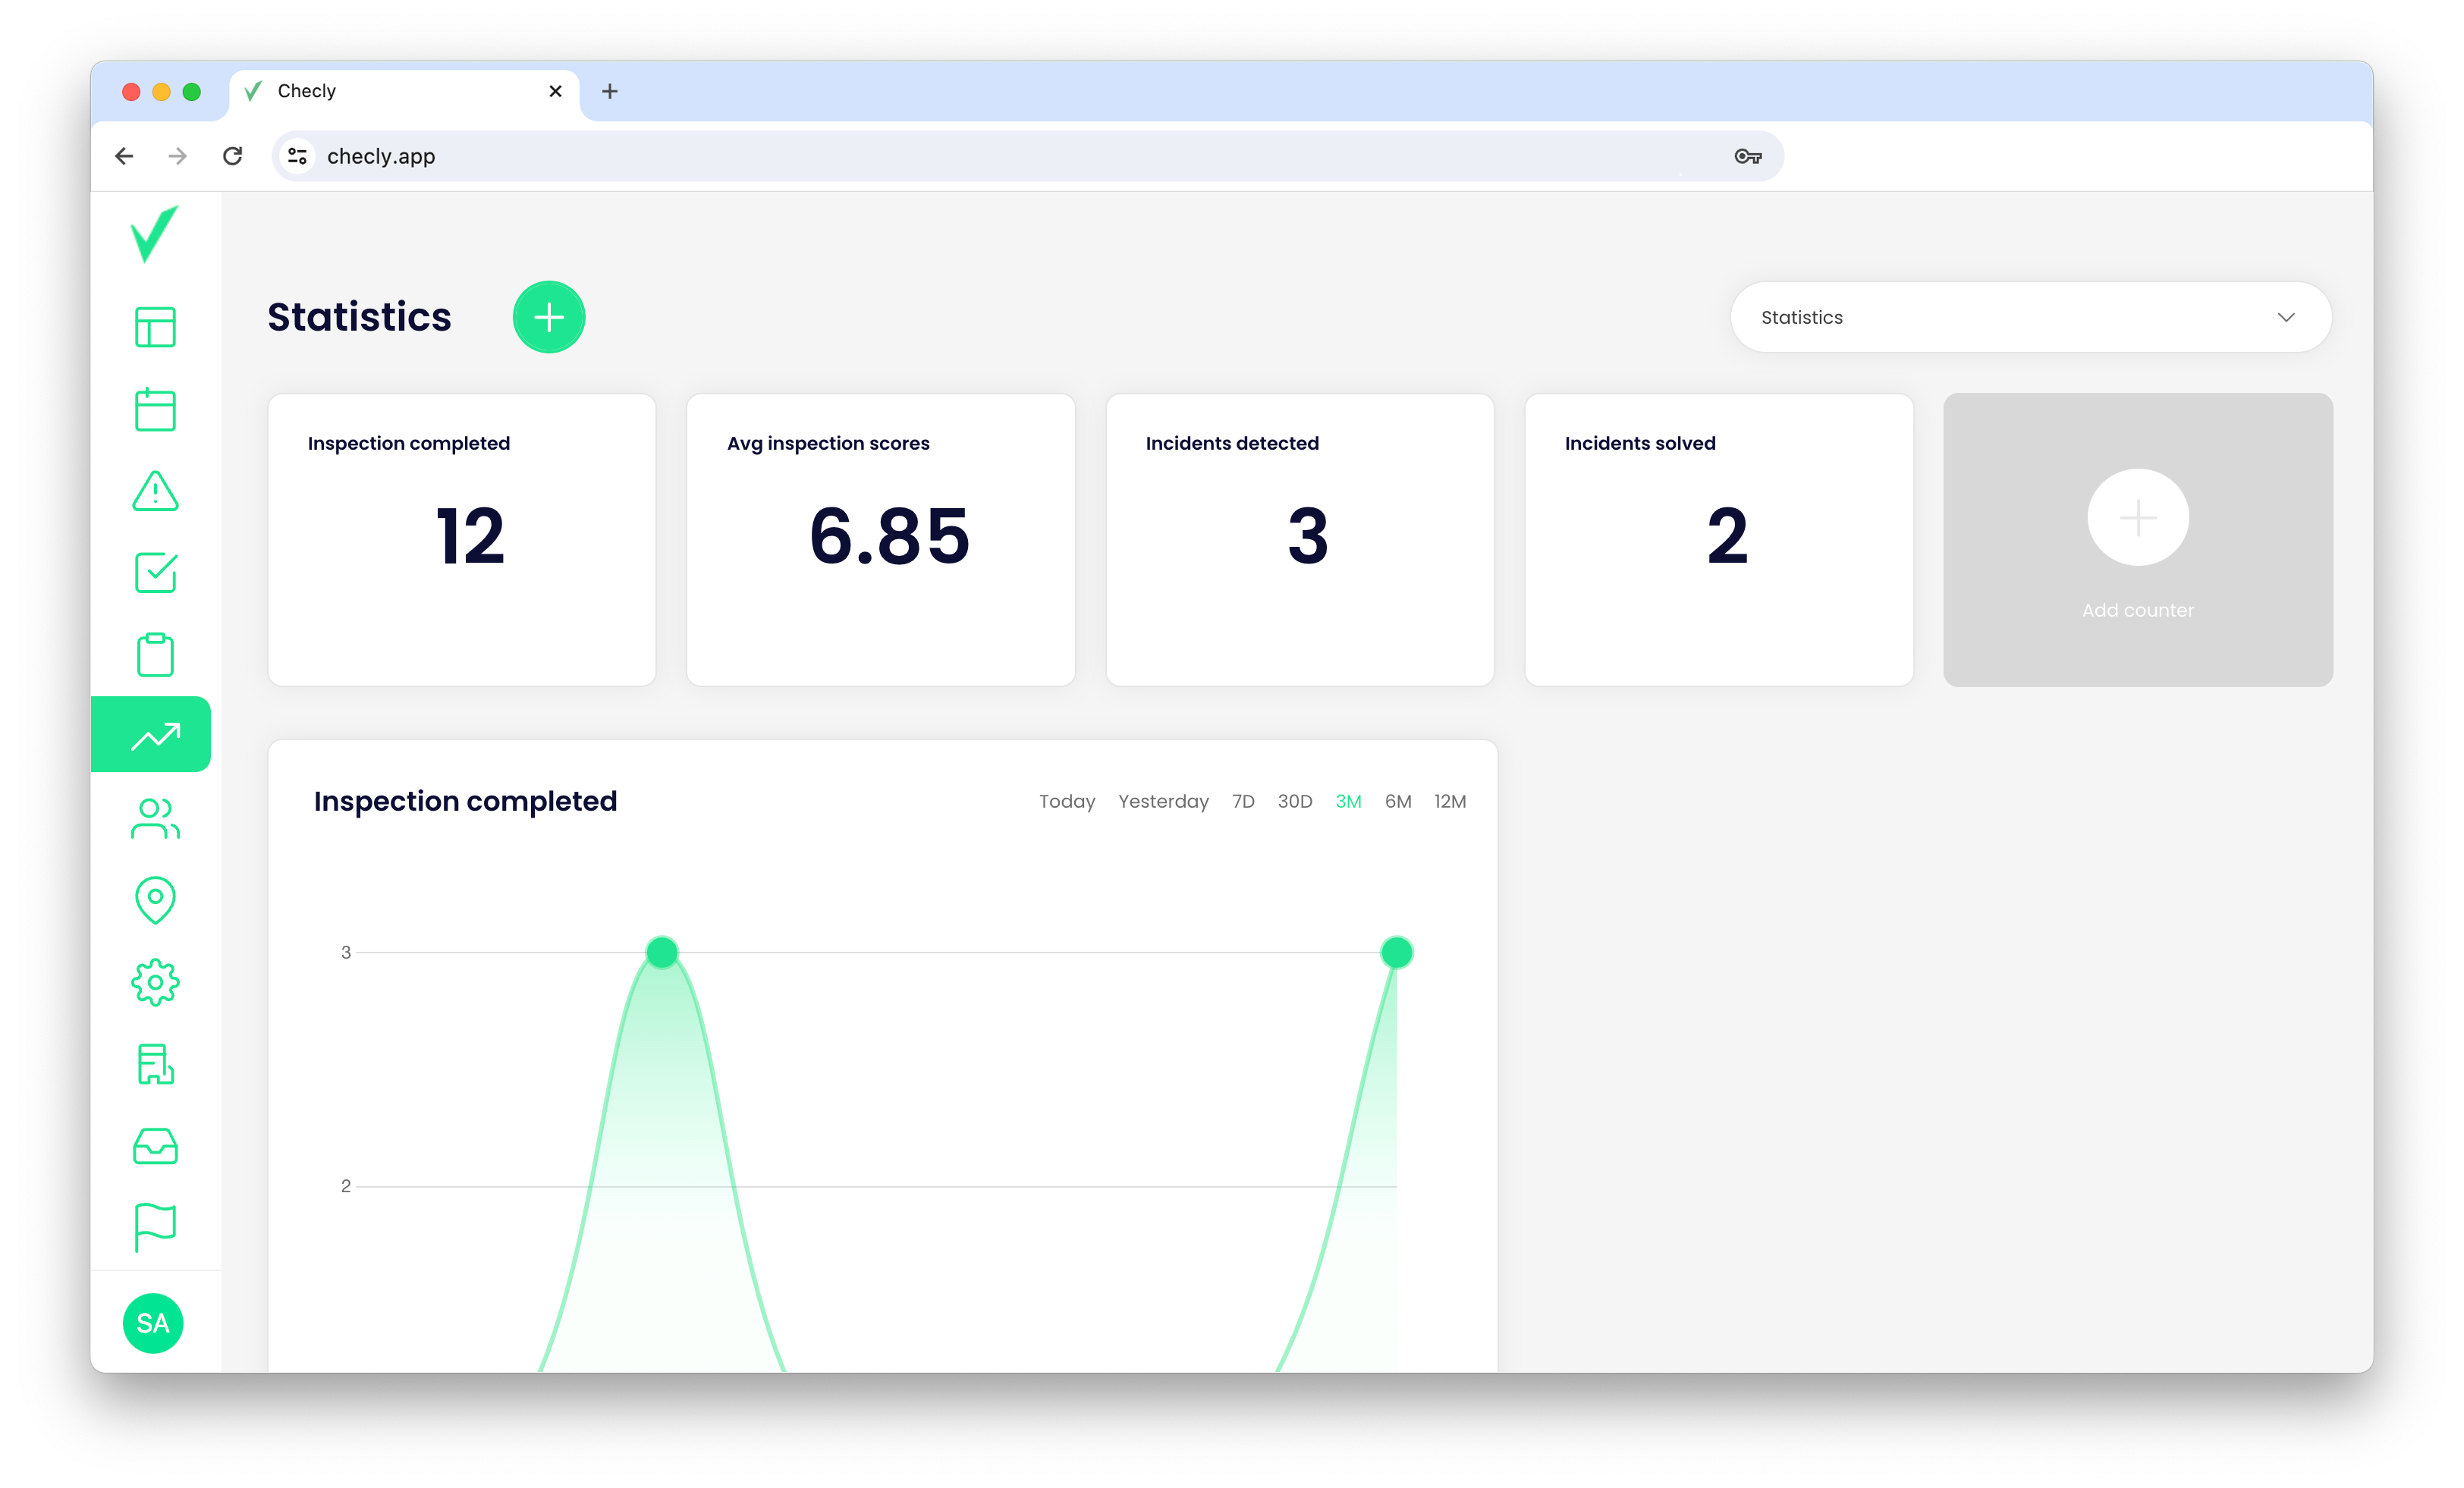
Each user has access to a predefined board that displays the most important data in a simple layout. Users can view the data based on their permission policy. The Organisation Admin has access to all data within their organisation, the Site Admin has access to data collected from the sites assigned to them, and the Inspector has access only to the data they have collected themselves.
Create the board
If you want to create a new board, you can follow these steps:
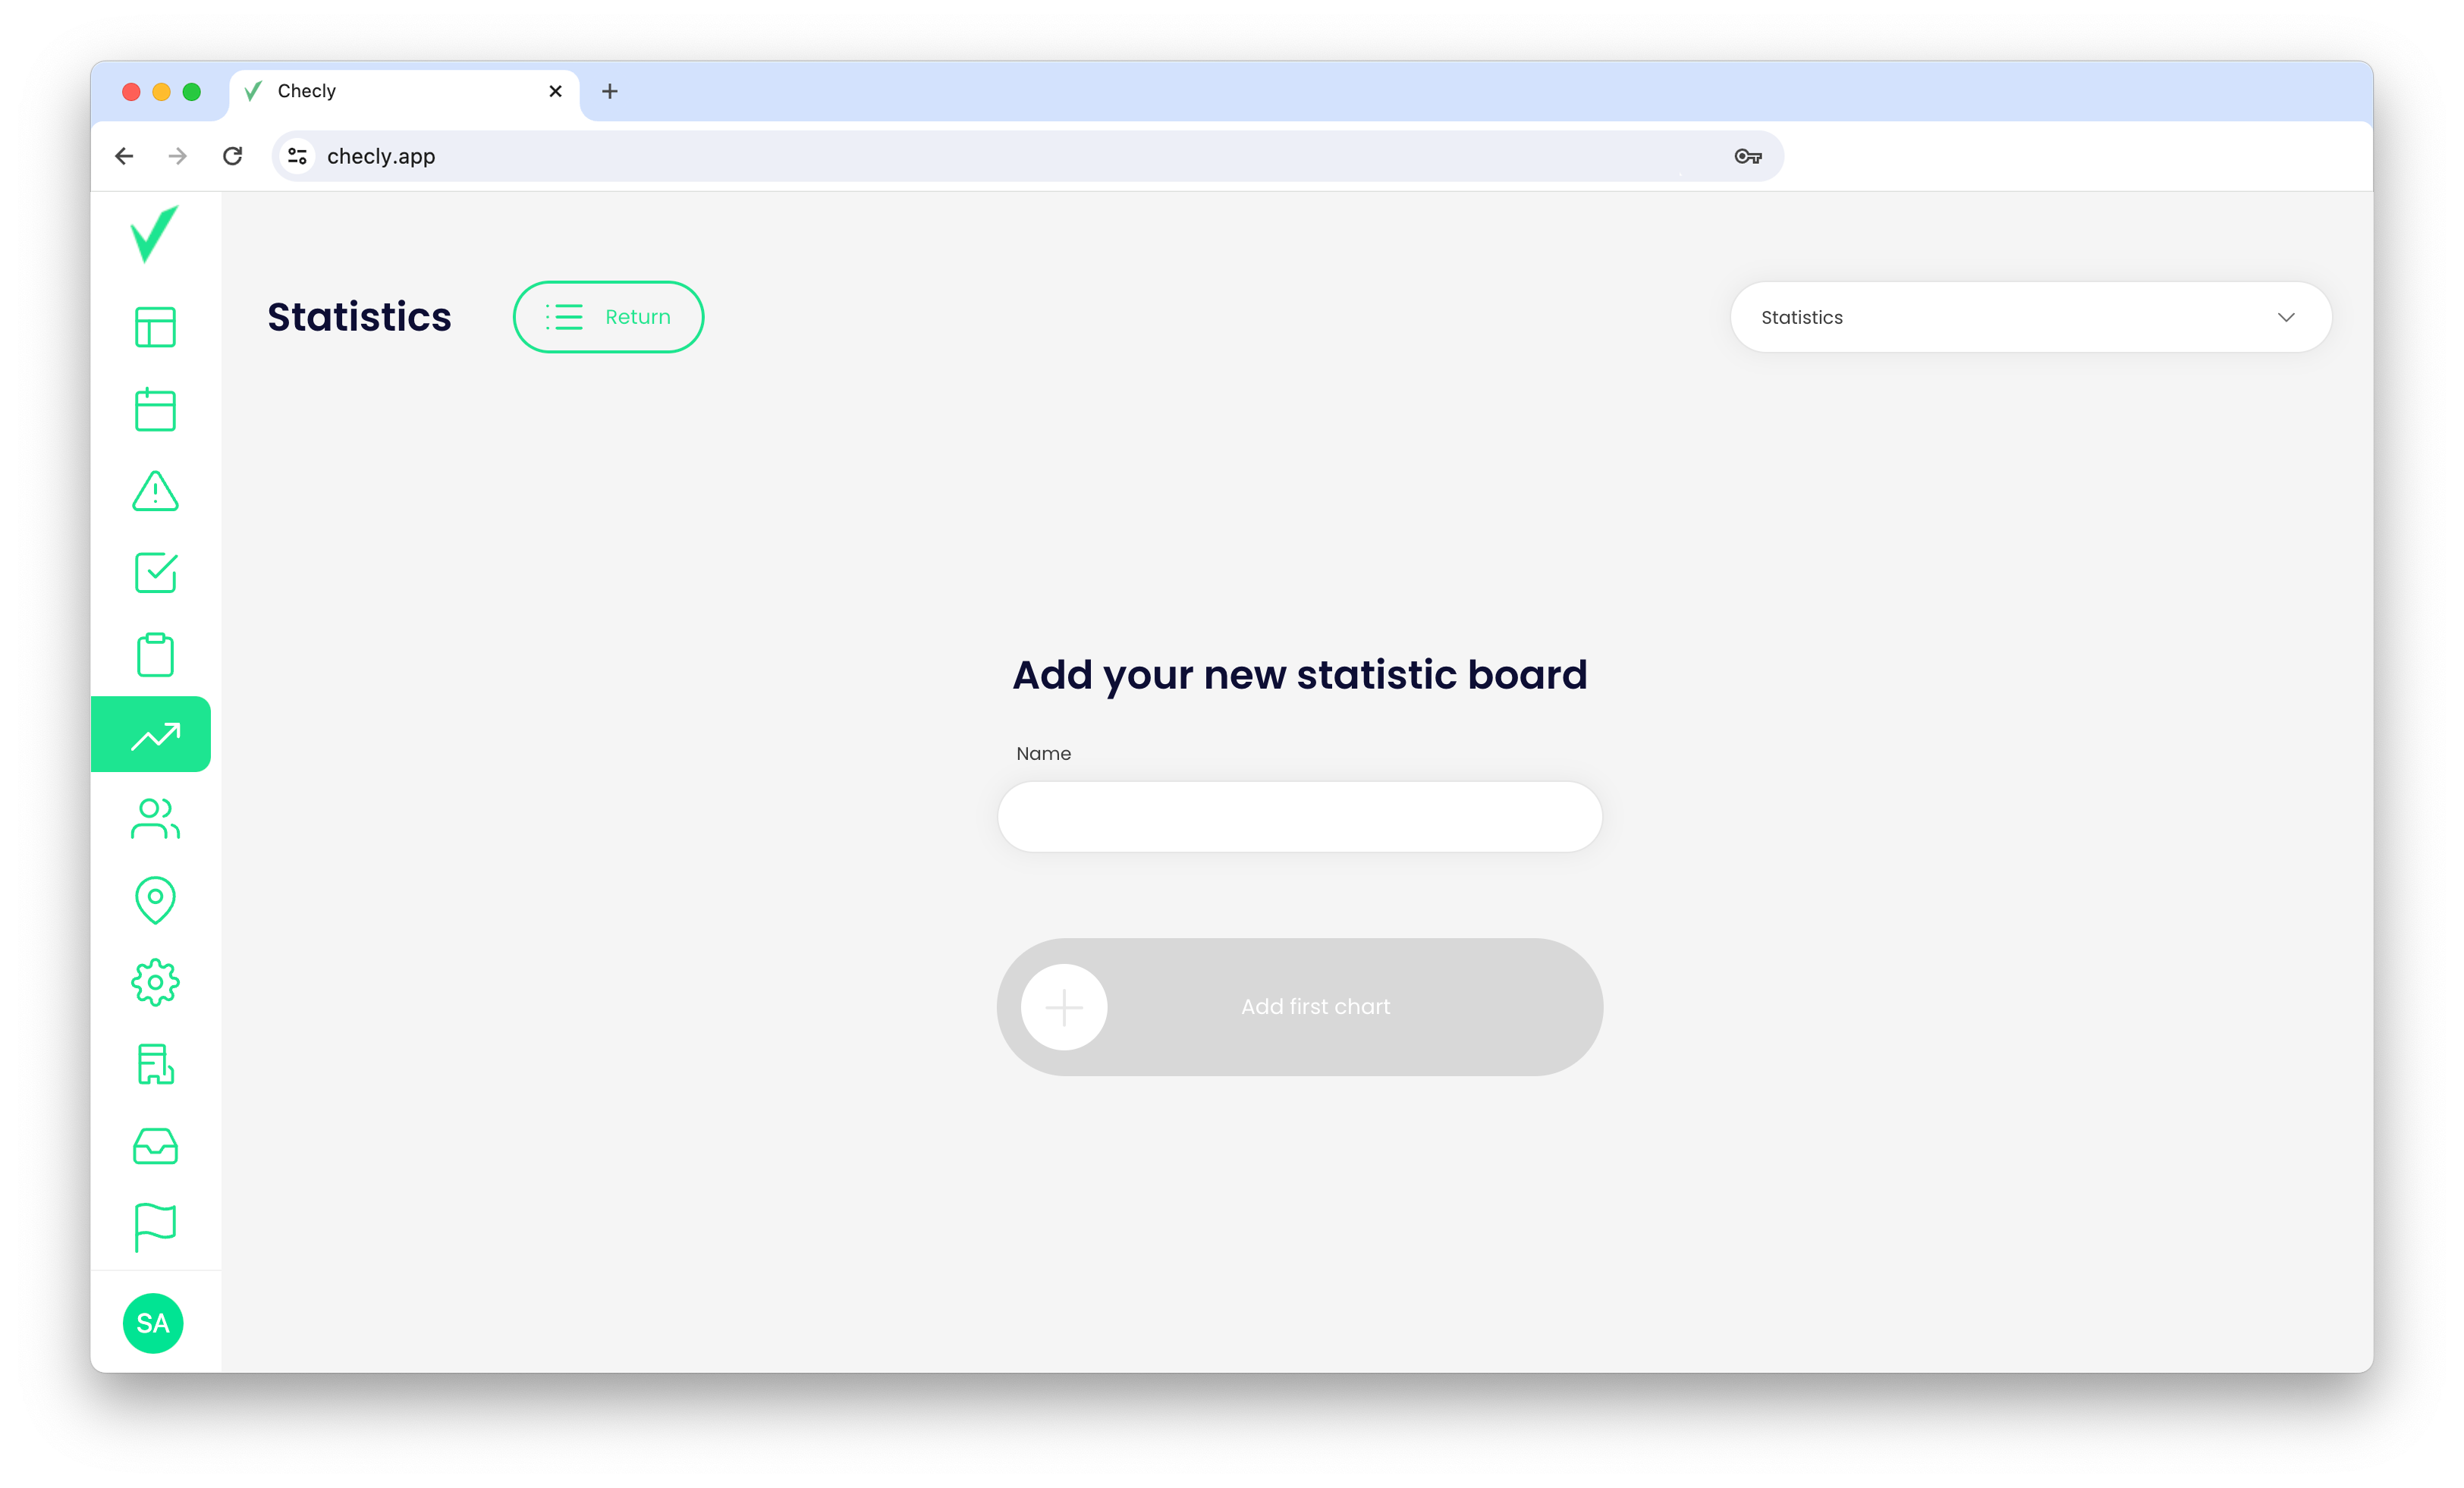
- Click the plus button next to the header.
- Please enter the name of your board and then click the "Add first chart" button.
- Please fill out the form in the left sidebar.
- Your board has been created.
Edit and delete the board
Each user can edit the default statistics board, but they cannot change the name or delete it.
- If you want to delete or edit the name of your board, you can follow these steps:
- To select a specific board, simply choose it from the dropdown menu located in the upper-right corner of the Statistics page.
- Click the pencil button next to the name of the board in this dropdown menu.
- Please enter the new name of your board and then click the Save button.
- Click the Delete button
- Your board has been updated.
Add the counter to the board
You can add up to ten counters to your board, allowing you to present the most important data in a clear and concise manner.
All you need to do is follow these steps:
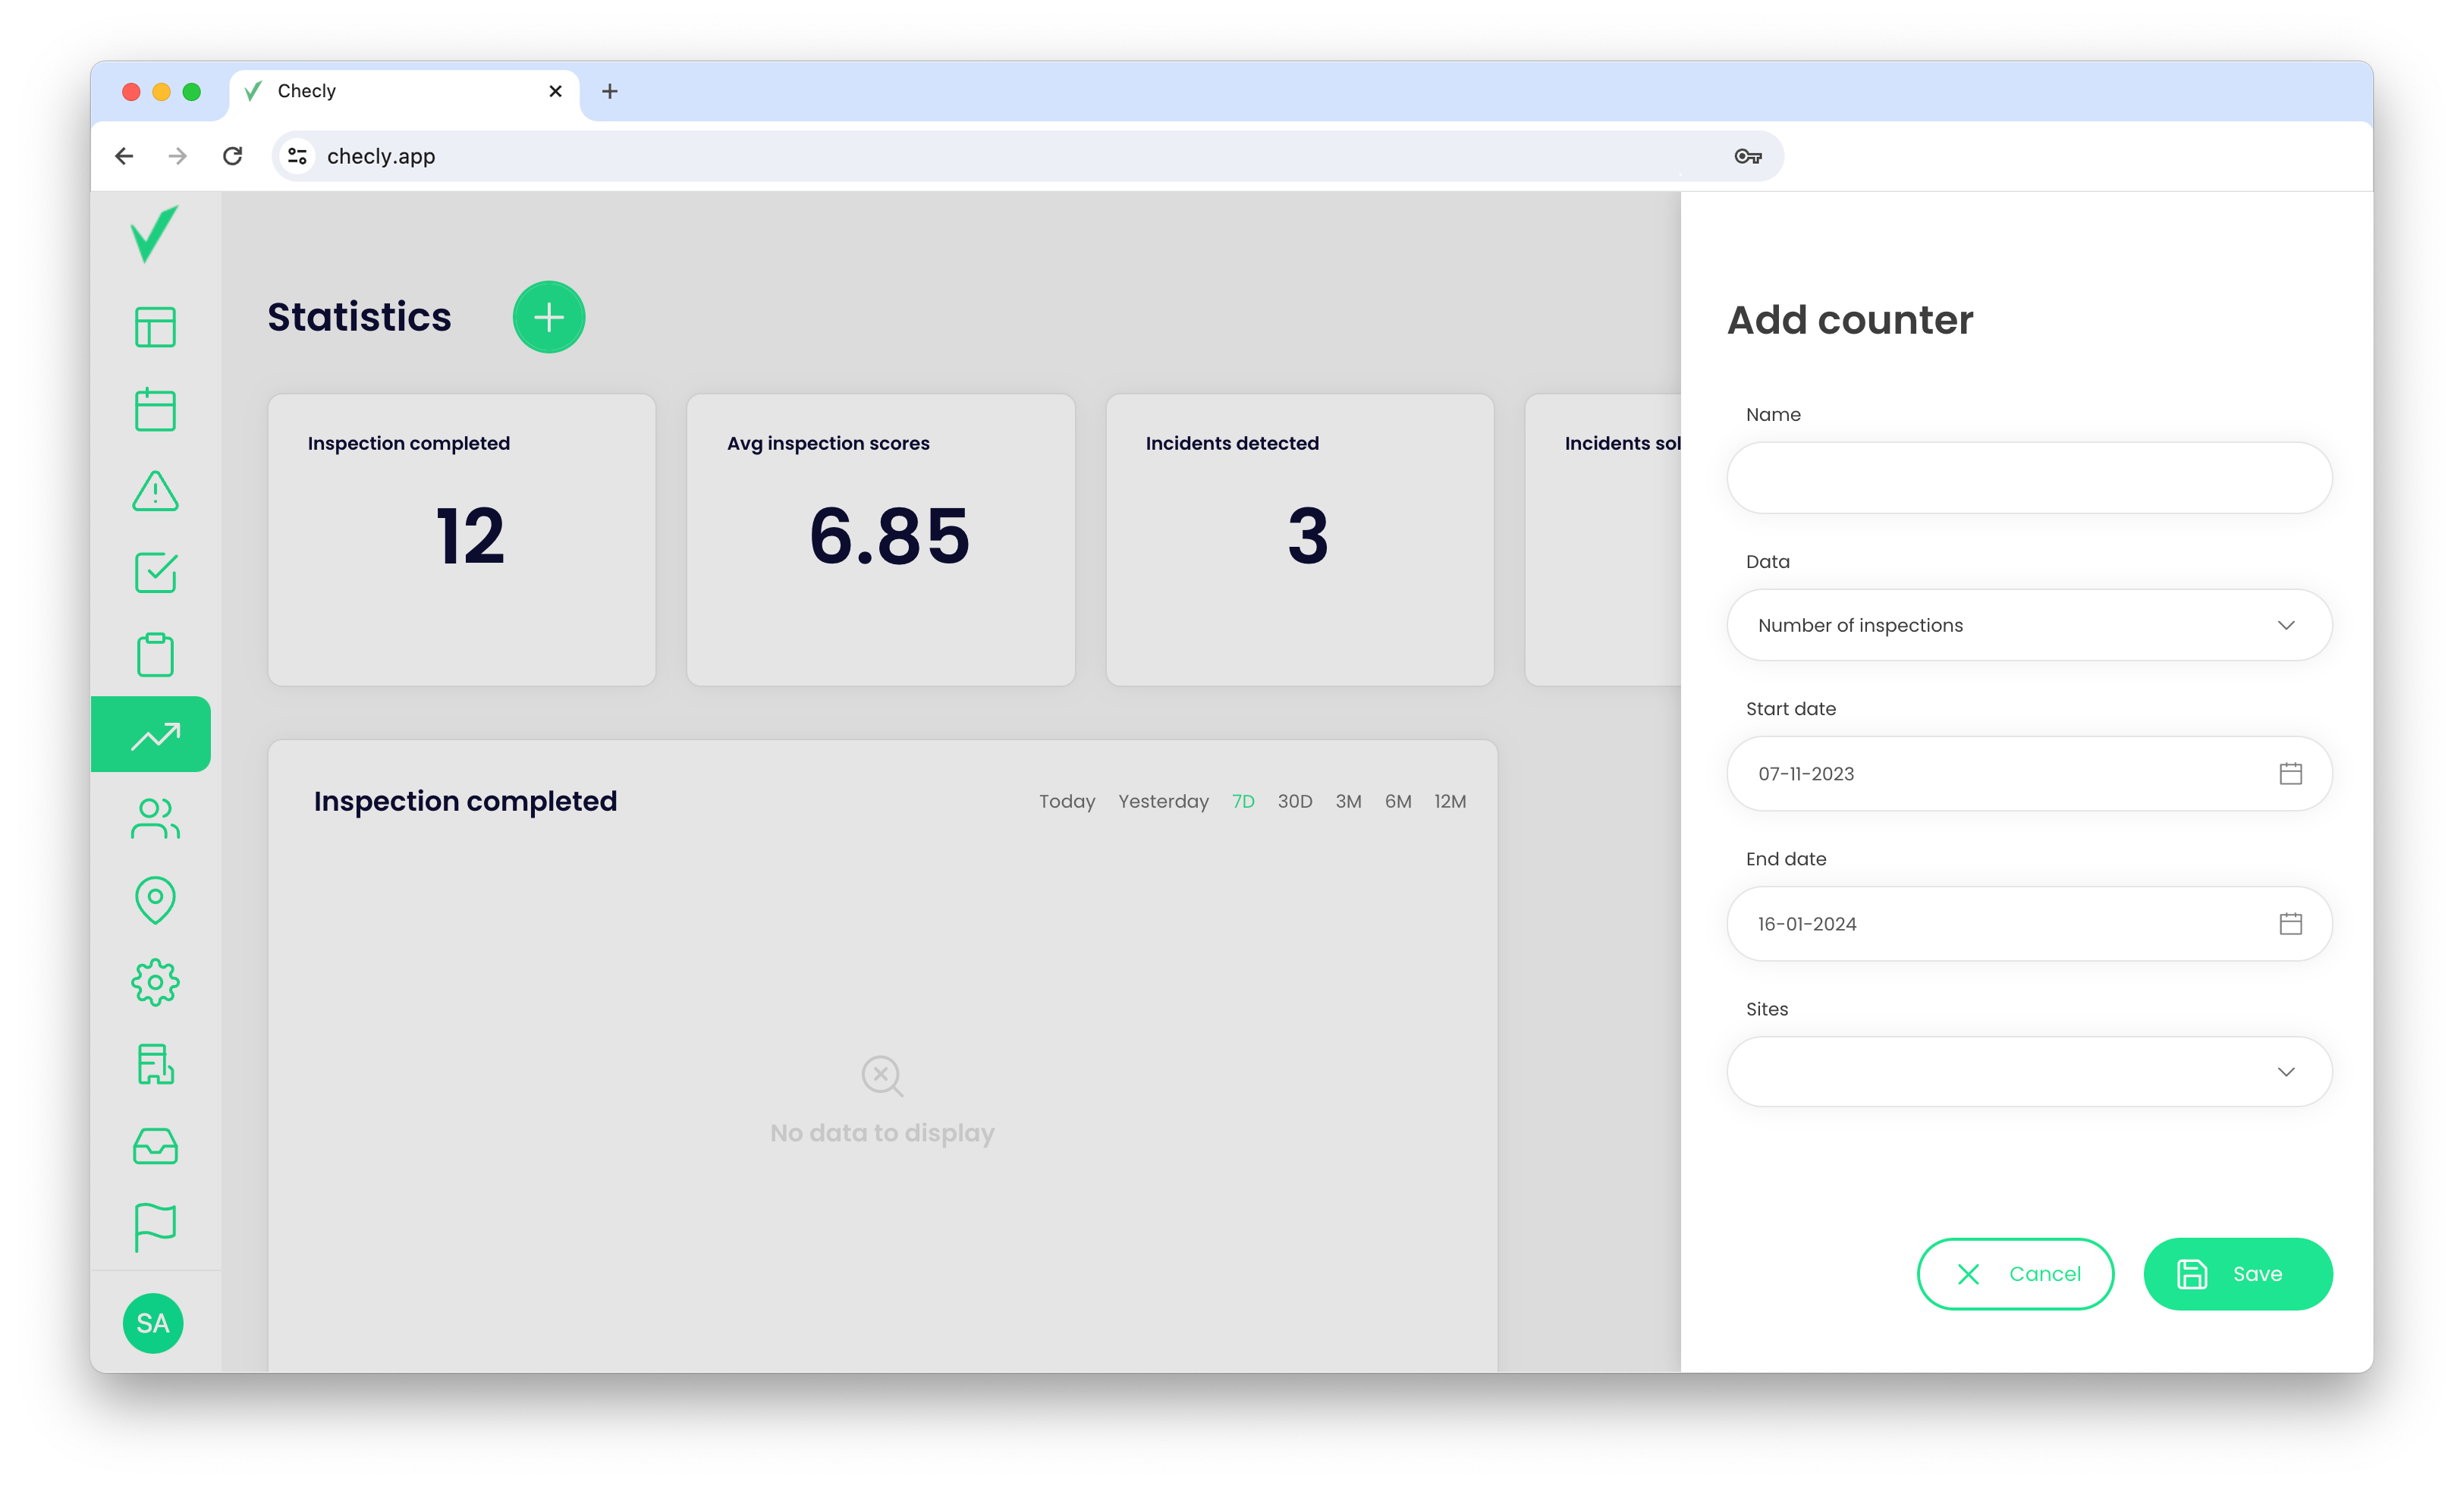
- Click the Add counter button.
- Fill out the form in sidebar:
- Enter the name of the counter.
- Choose the data source.
- Choose the period range by setting the start and end dates. If you leave these fields empty, the app will display the entire available period.
- Select the sites. If you leave this field empty, the app will display data from all available sites.
- Select the users. If you leave this field empty, the app will display data from all available users.
- Click the Save button.
Edit or delete the counter
If you wish to delete or edit a counter, you can follow these simple steps:
- Hover the mouse cursor over the specific counter, then click on the 3-dots menu icon.
- Please fill out the form and click the Save button.
- Click the Delete button.
- Your counter has been updated.
Add the chart to the board
You can add an unlimited number of charts to your board. Charts help organize data clearly and concisely.
All you need to do is follow these steps:
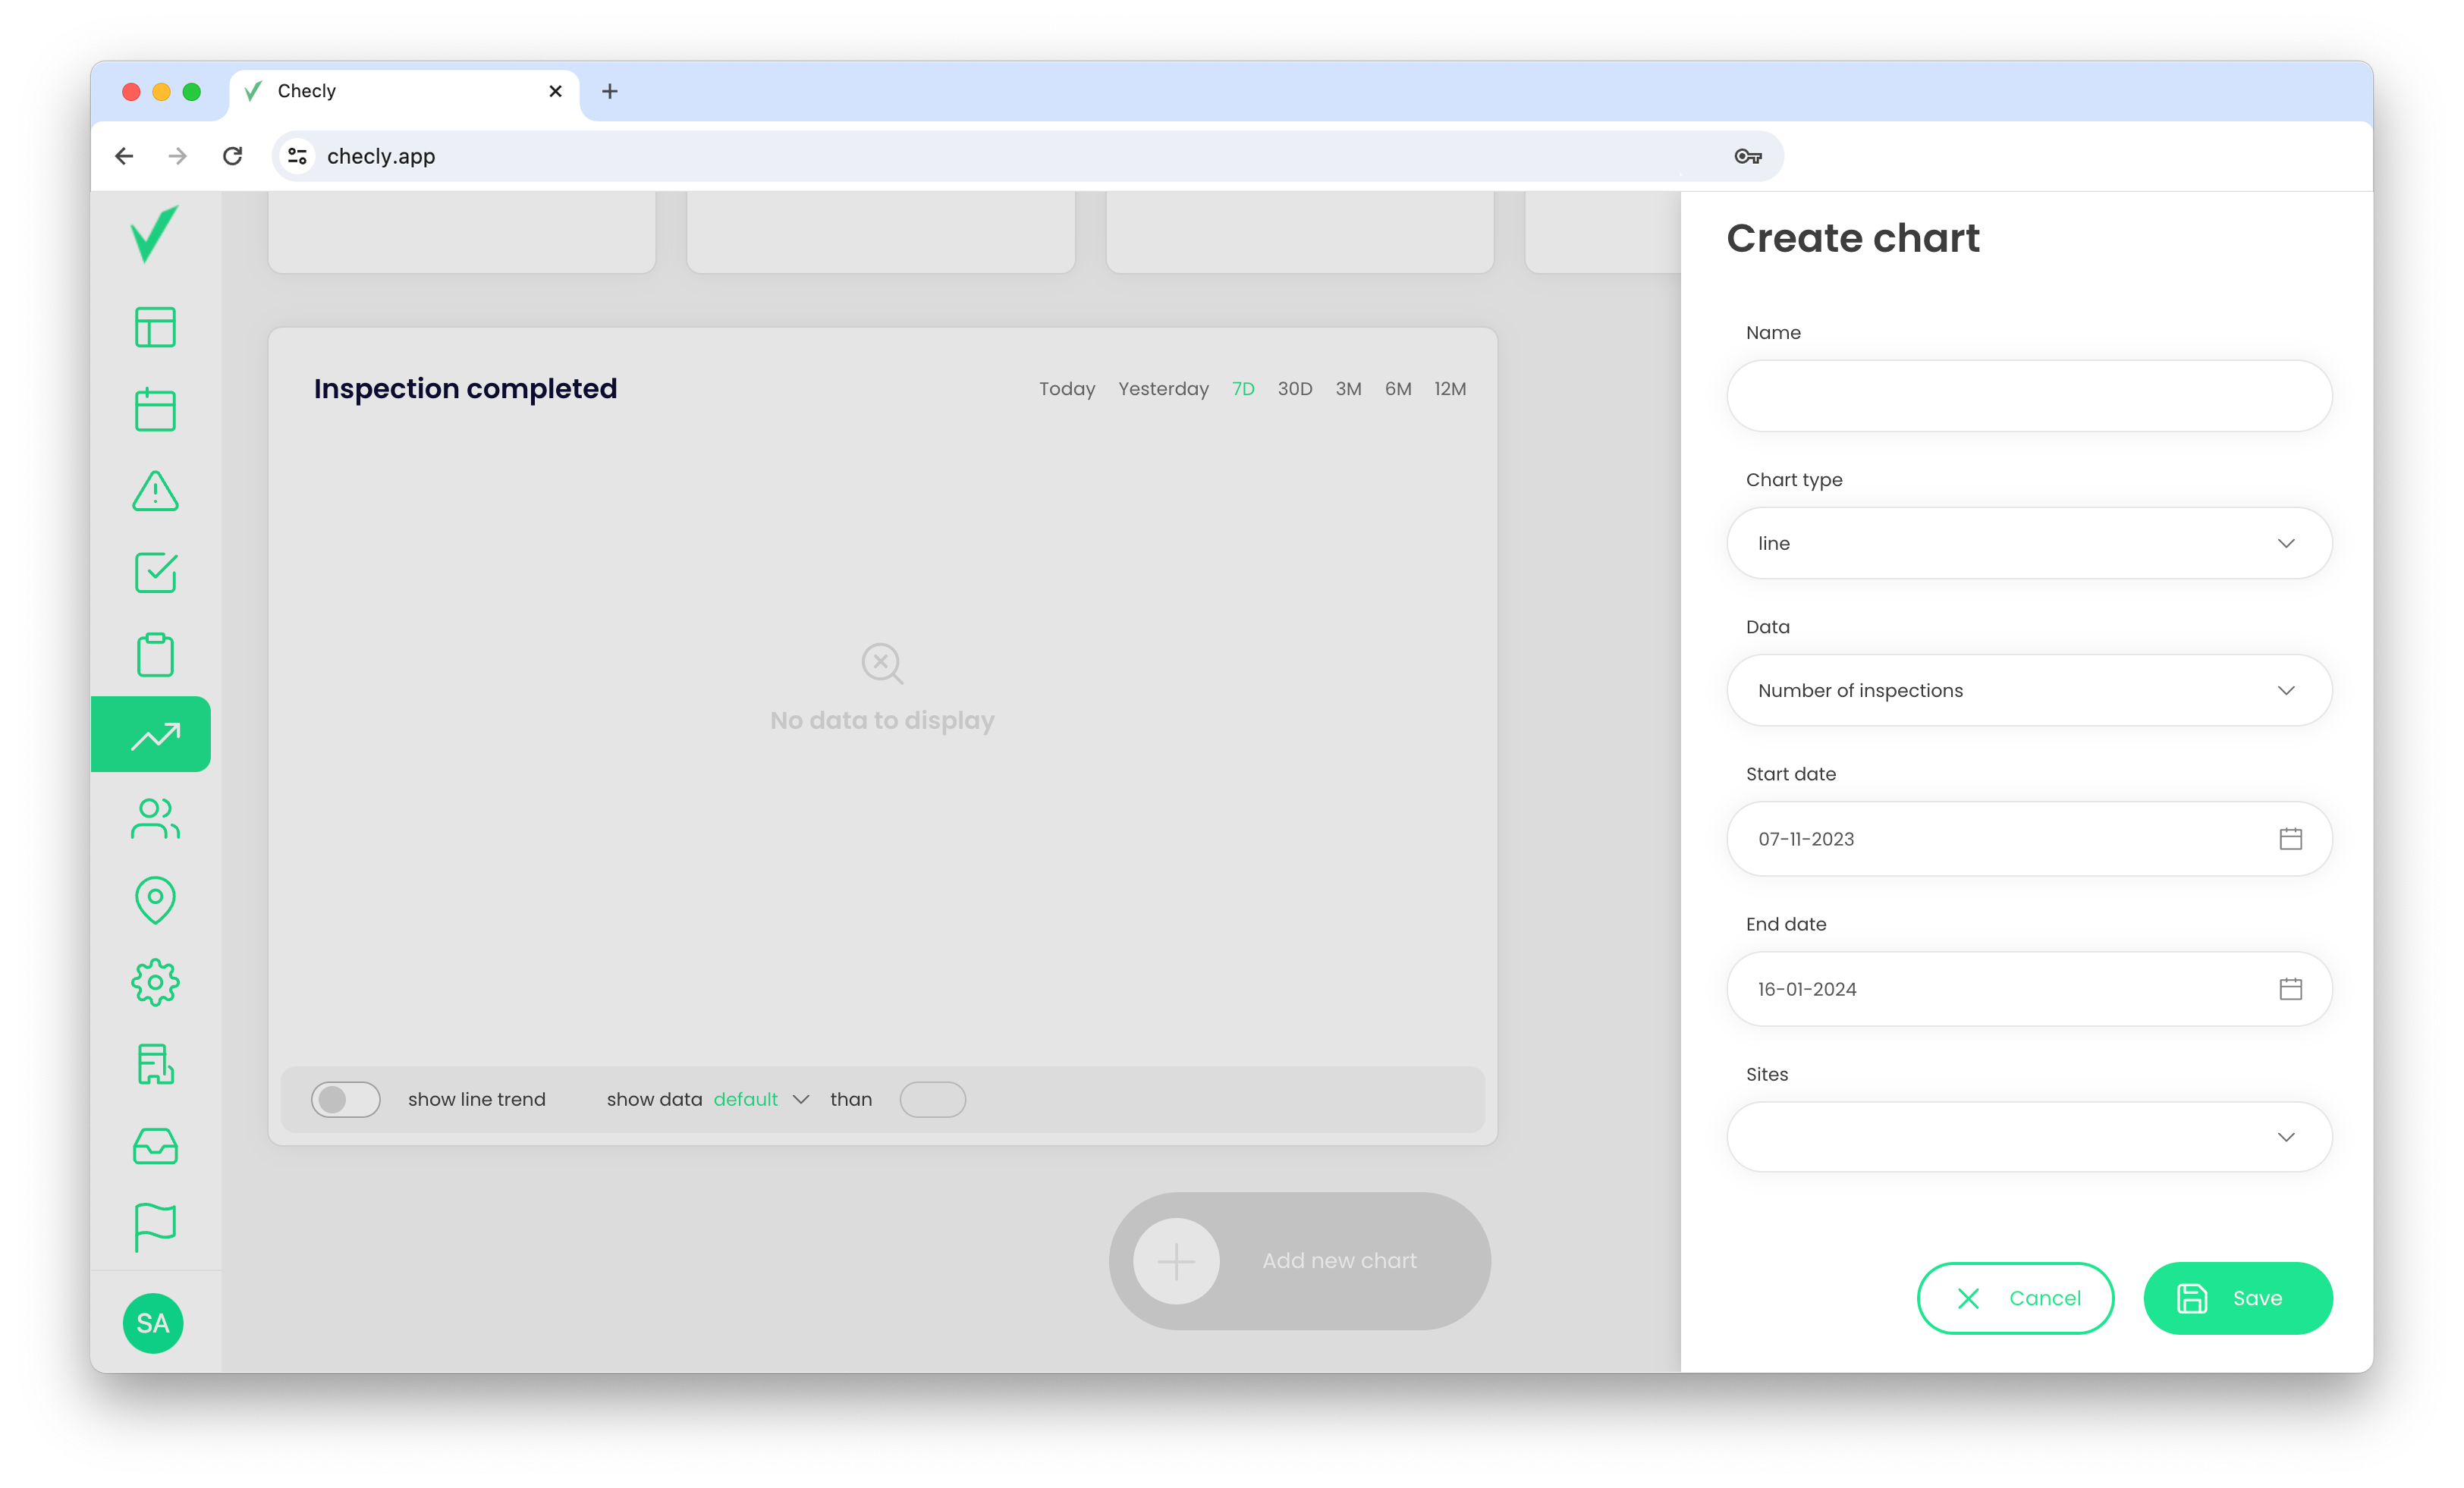
- Click the "Add chart" button, located at the bottom of your board.
- Fill out the form in the sidebar:
- Enter the name of the chart.
- Select the chart type. You have the option to choose between line and bar charts.
- Choose the data source.
- Select the desired period range by setting the start and end dates. If you leave these fields empty, the app will display the entire available period.
- Select the sites. If you leave this field empty, the app will display data from all available sites.
- Select the users. If you leave this field empty, the app will display data from all available users.
- Click the Save button.
Edit or delete the chart
If you want to delete or edit a chart, you can follow these steps:
- Hover your mouse cursor over the specific chart, then click on the 3-dots menu icon.
- Please fill out the form and click on the Save button.
- Click the Delete button.
- Your chart has been updated.