Using the charts
Introduction
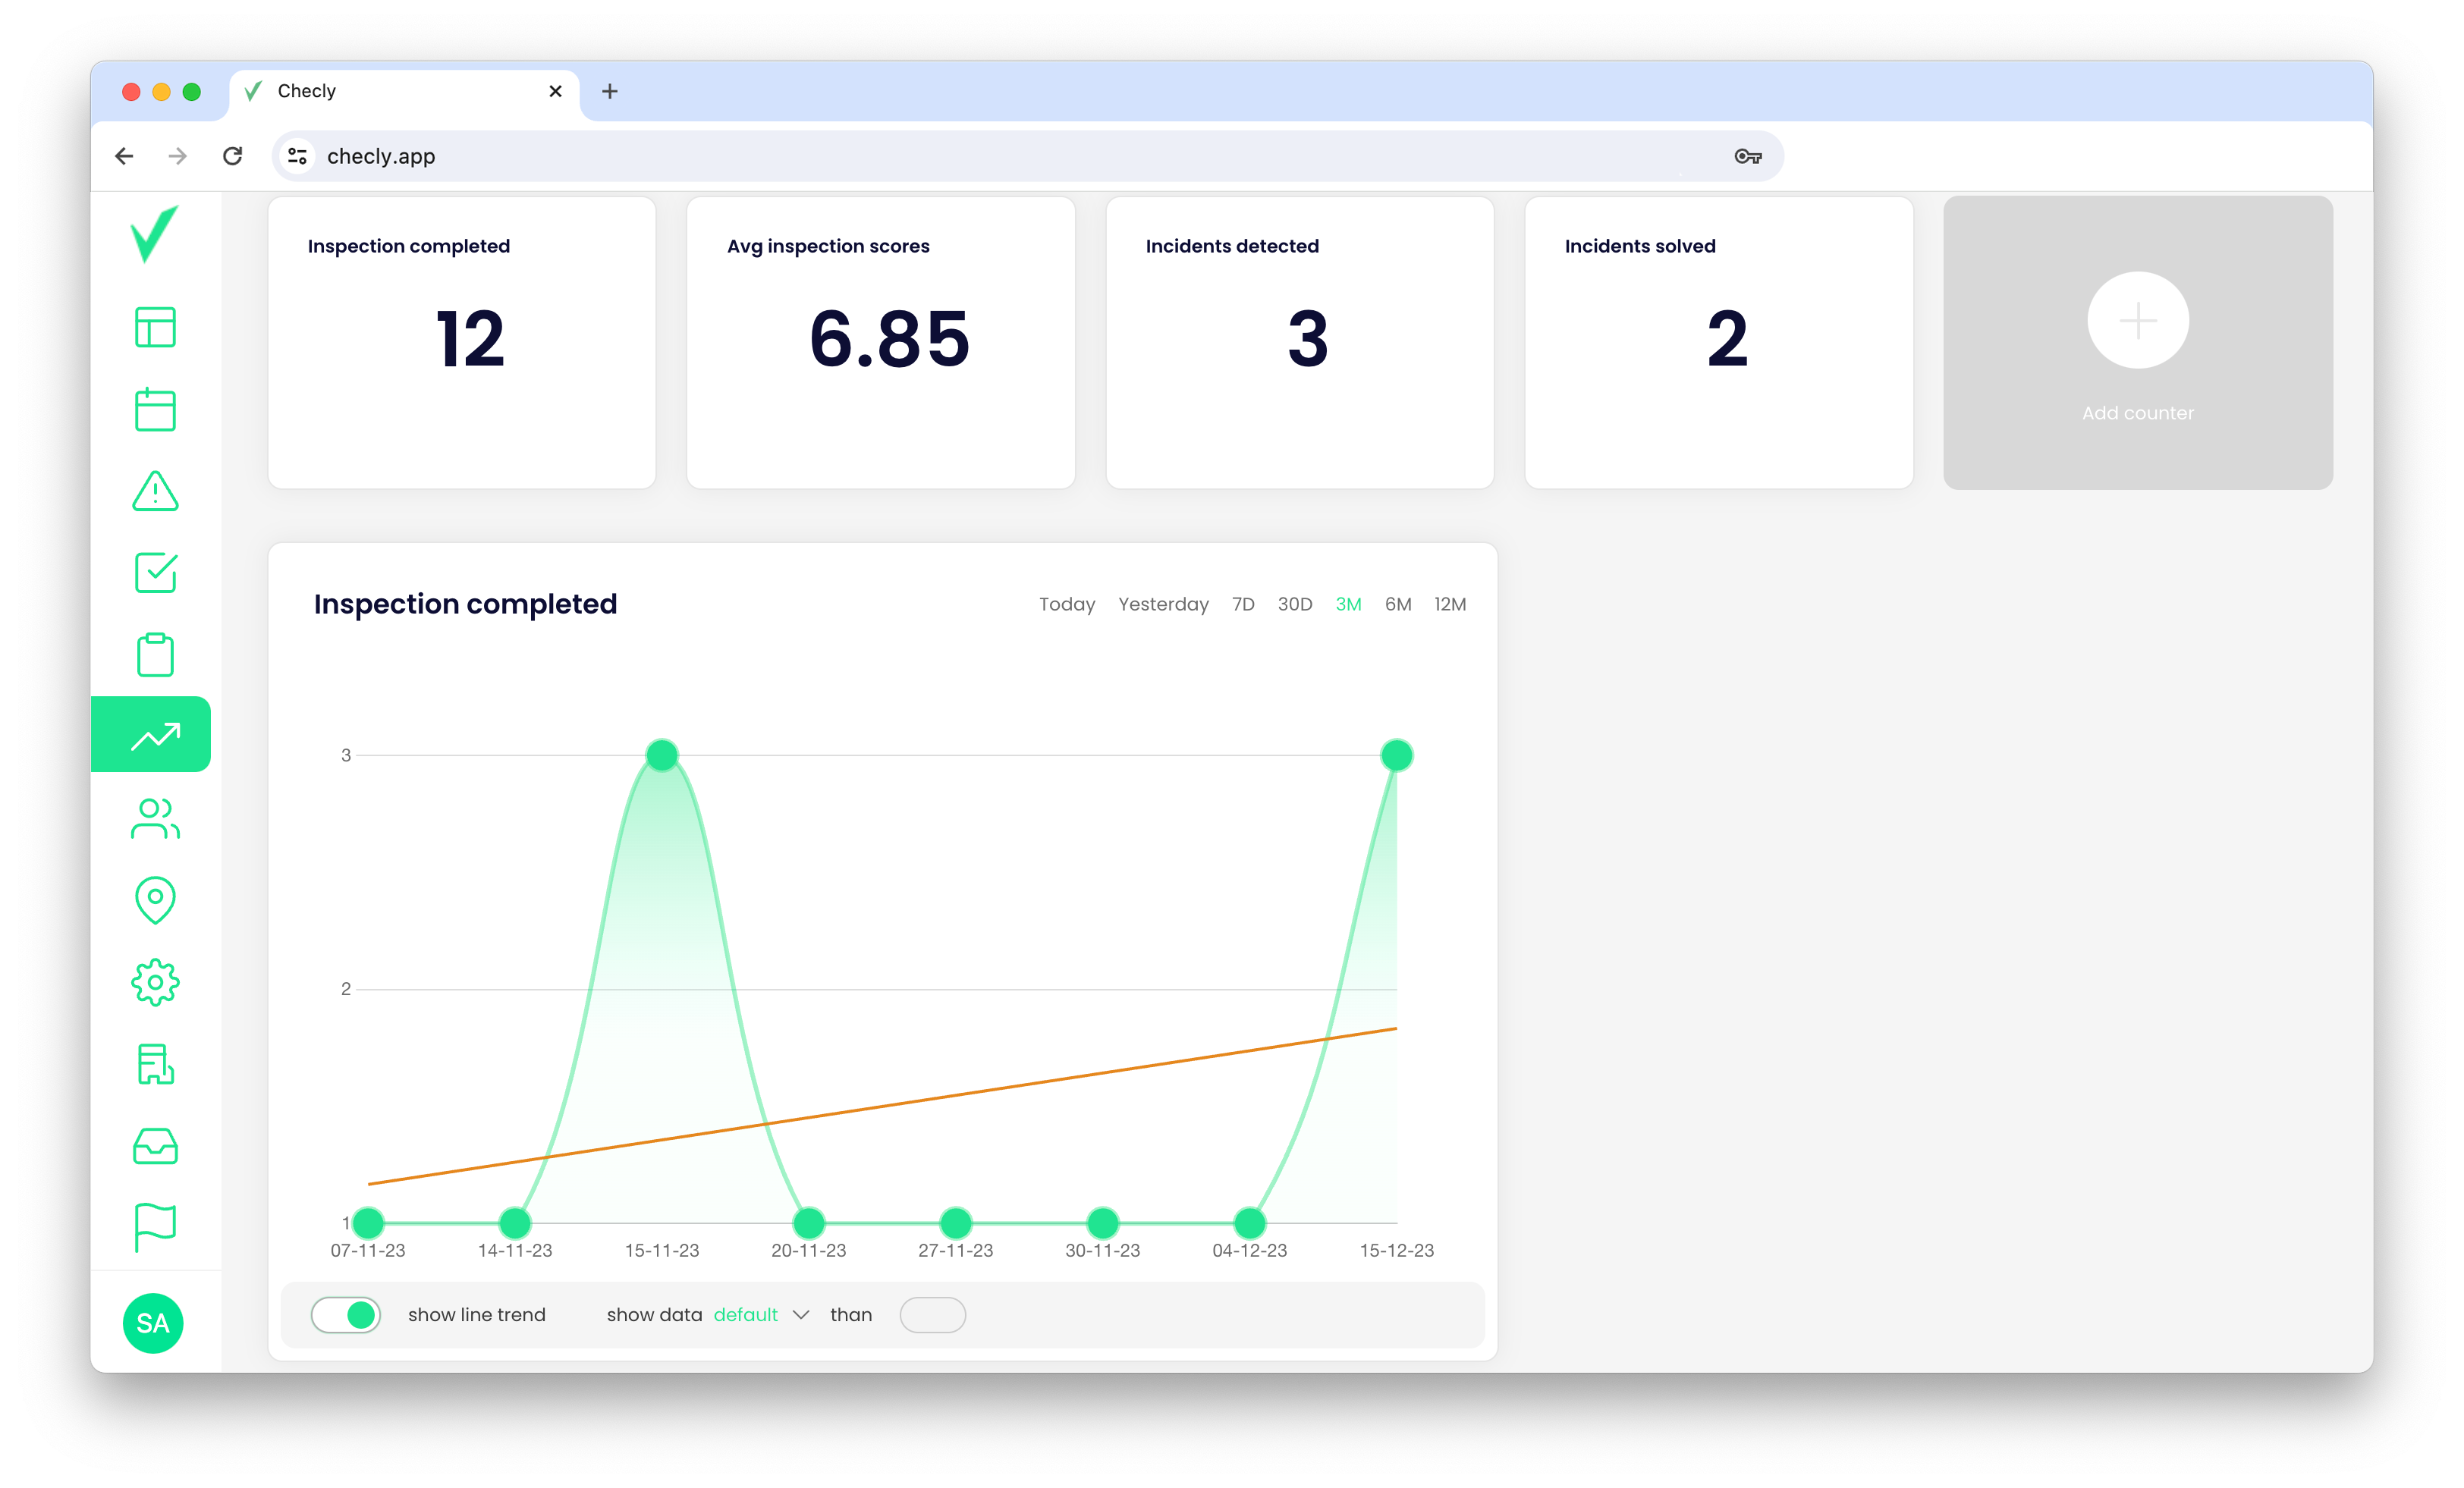
You can utilise the trend line to predict events within your organisation. It serves as the first step in advanced data analysis. Soon, we will provide you with a powerful AI-based tool to enhance your understanding of your organisation's data.
The trend line
Each chart has its own switch for the trend line. You can easily switch the line on and off for each chart. This smart feature helps you better understand the collected data and predict events based on this data within your organisation.
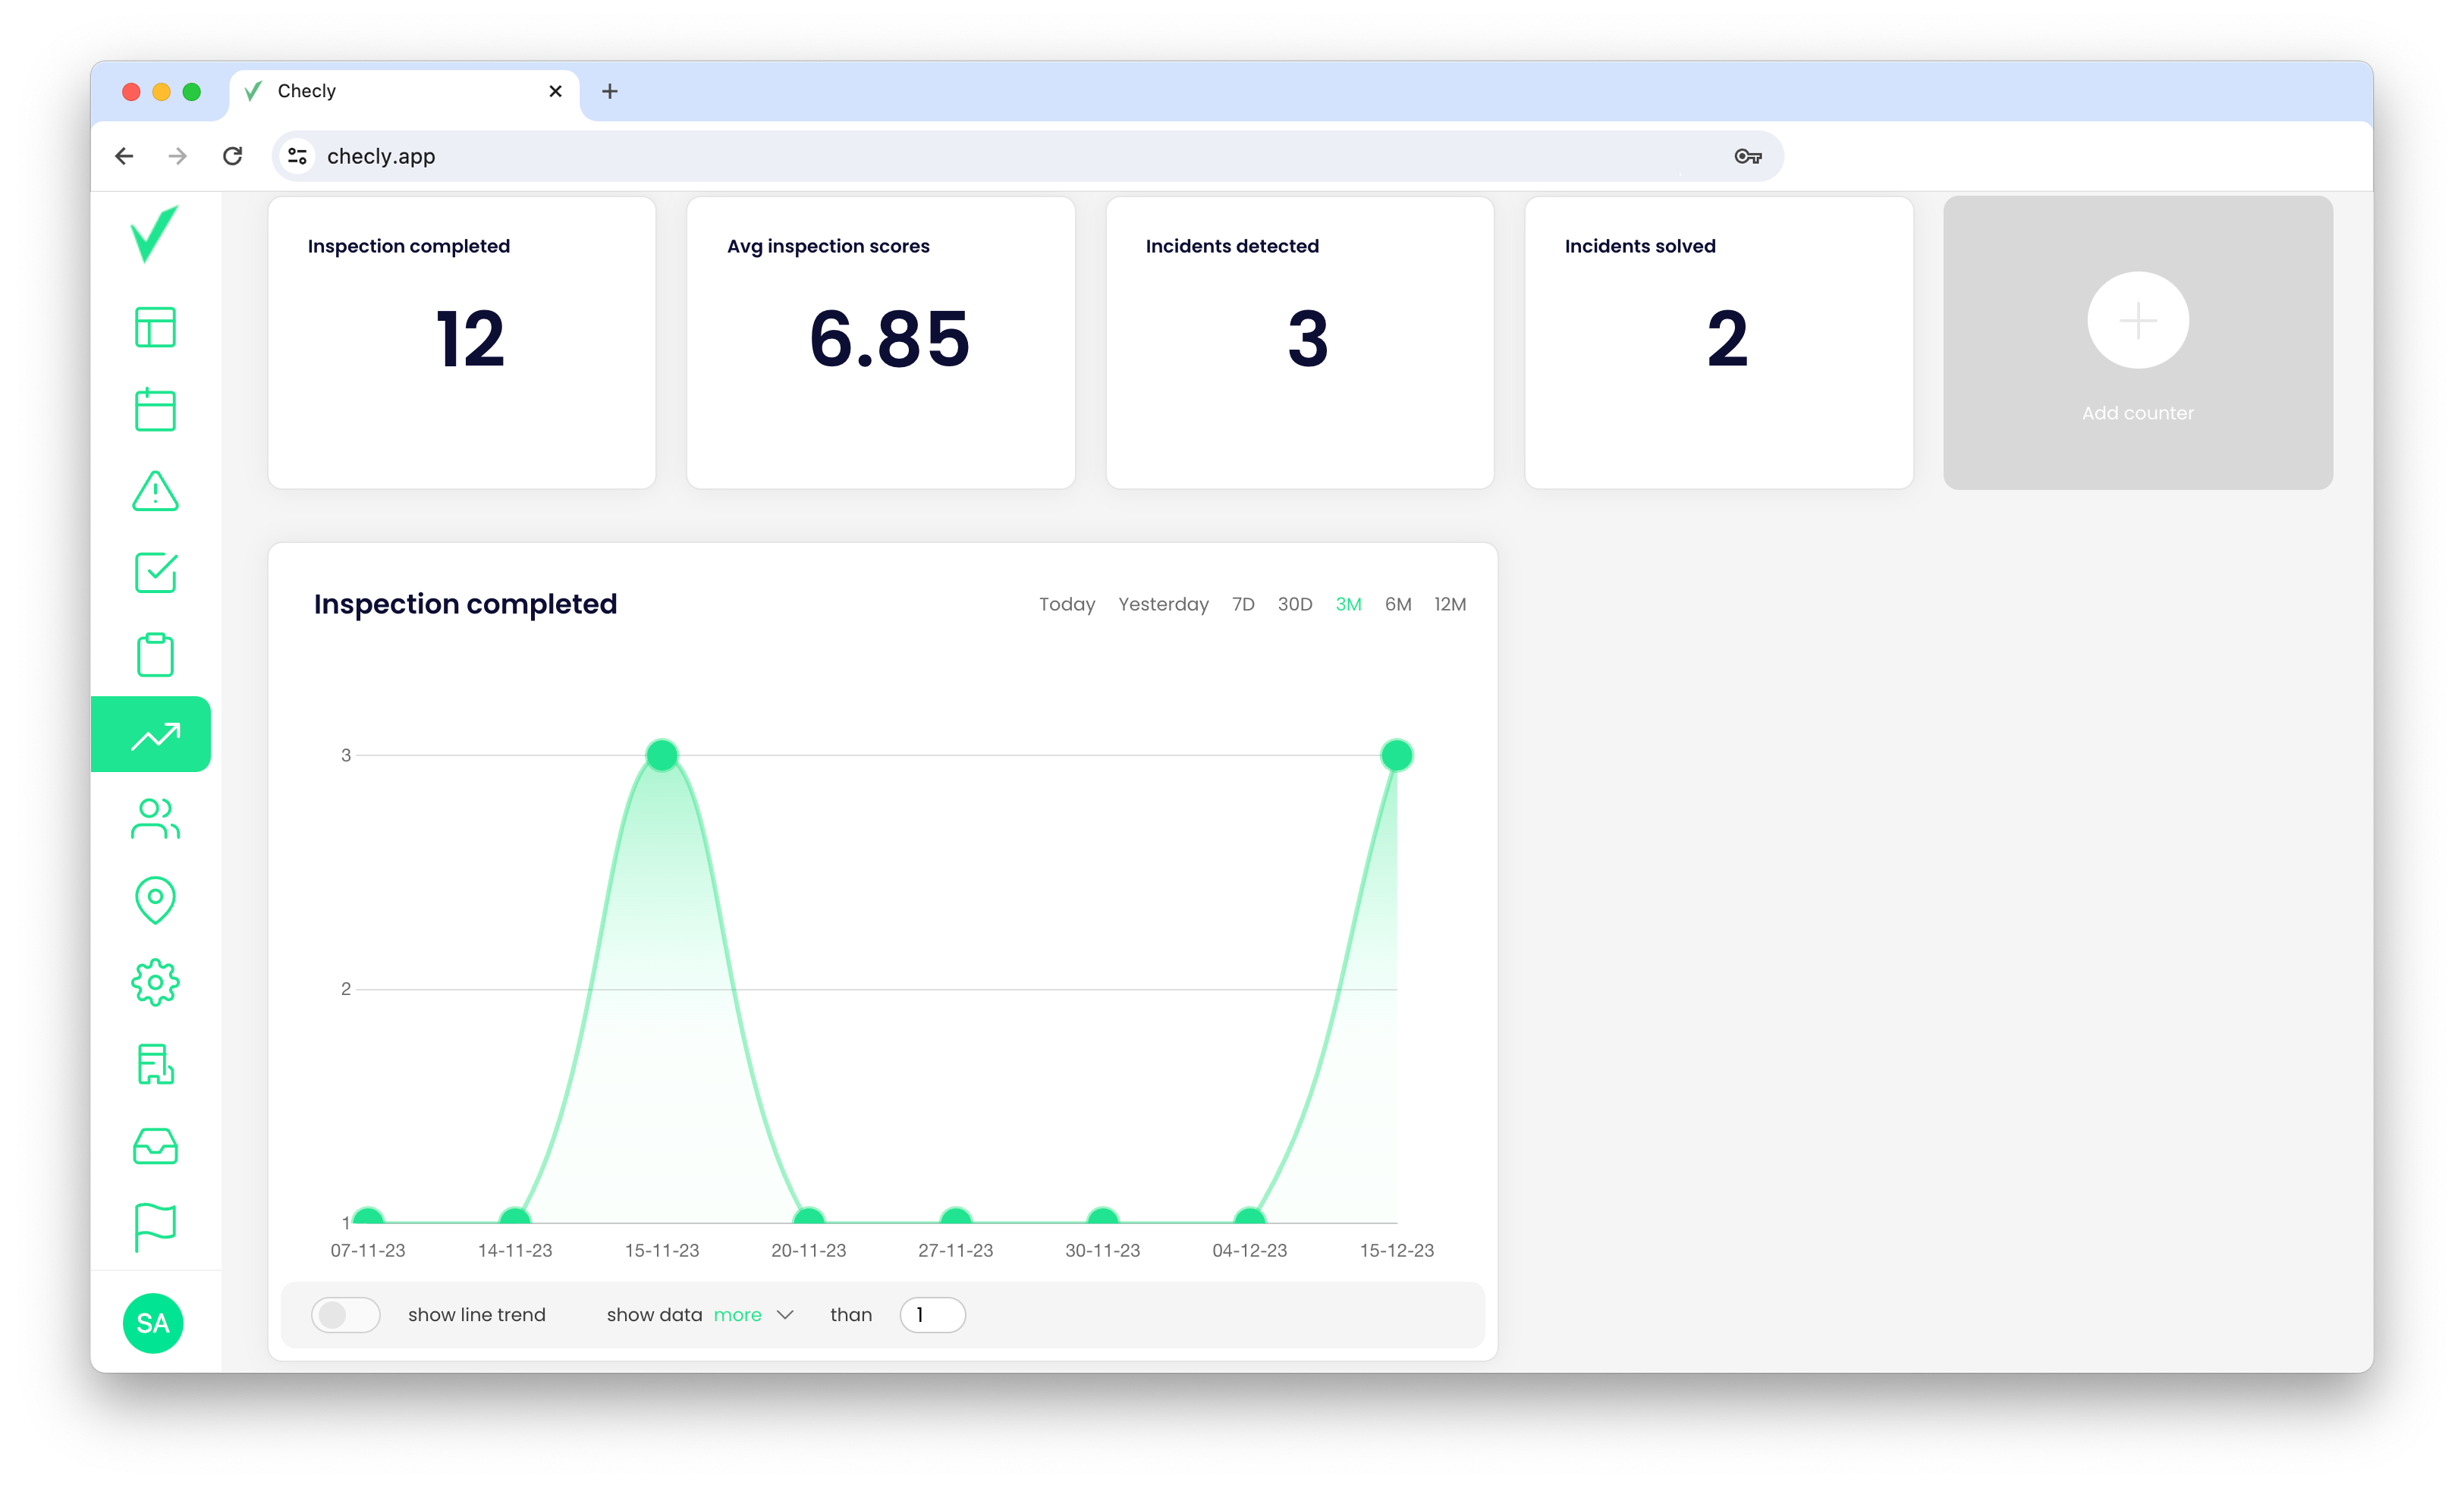
Smart filter „Show data”
If you want, you can use the "Show data" feature to display the data in a specific range.
For example, if you want to display only inspections with a score of 80 or higher, you can use the "show data" feature. Select "more" and enter 80 in the input field. The app will then display only inspections that have a score of 80 or higher on the chart.